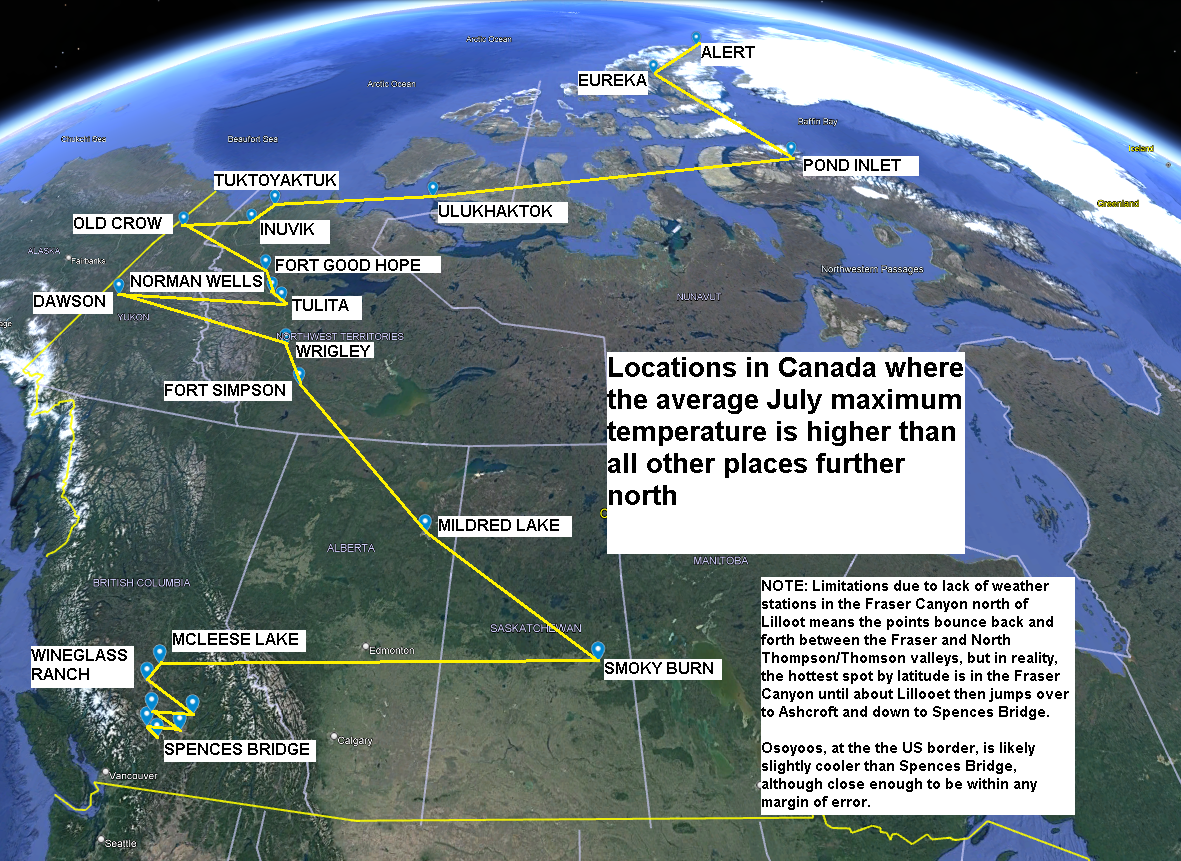
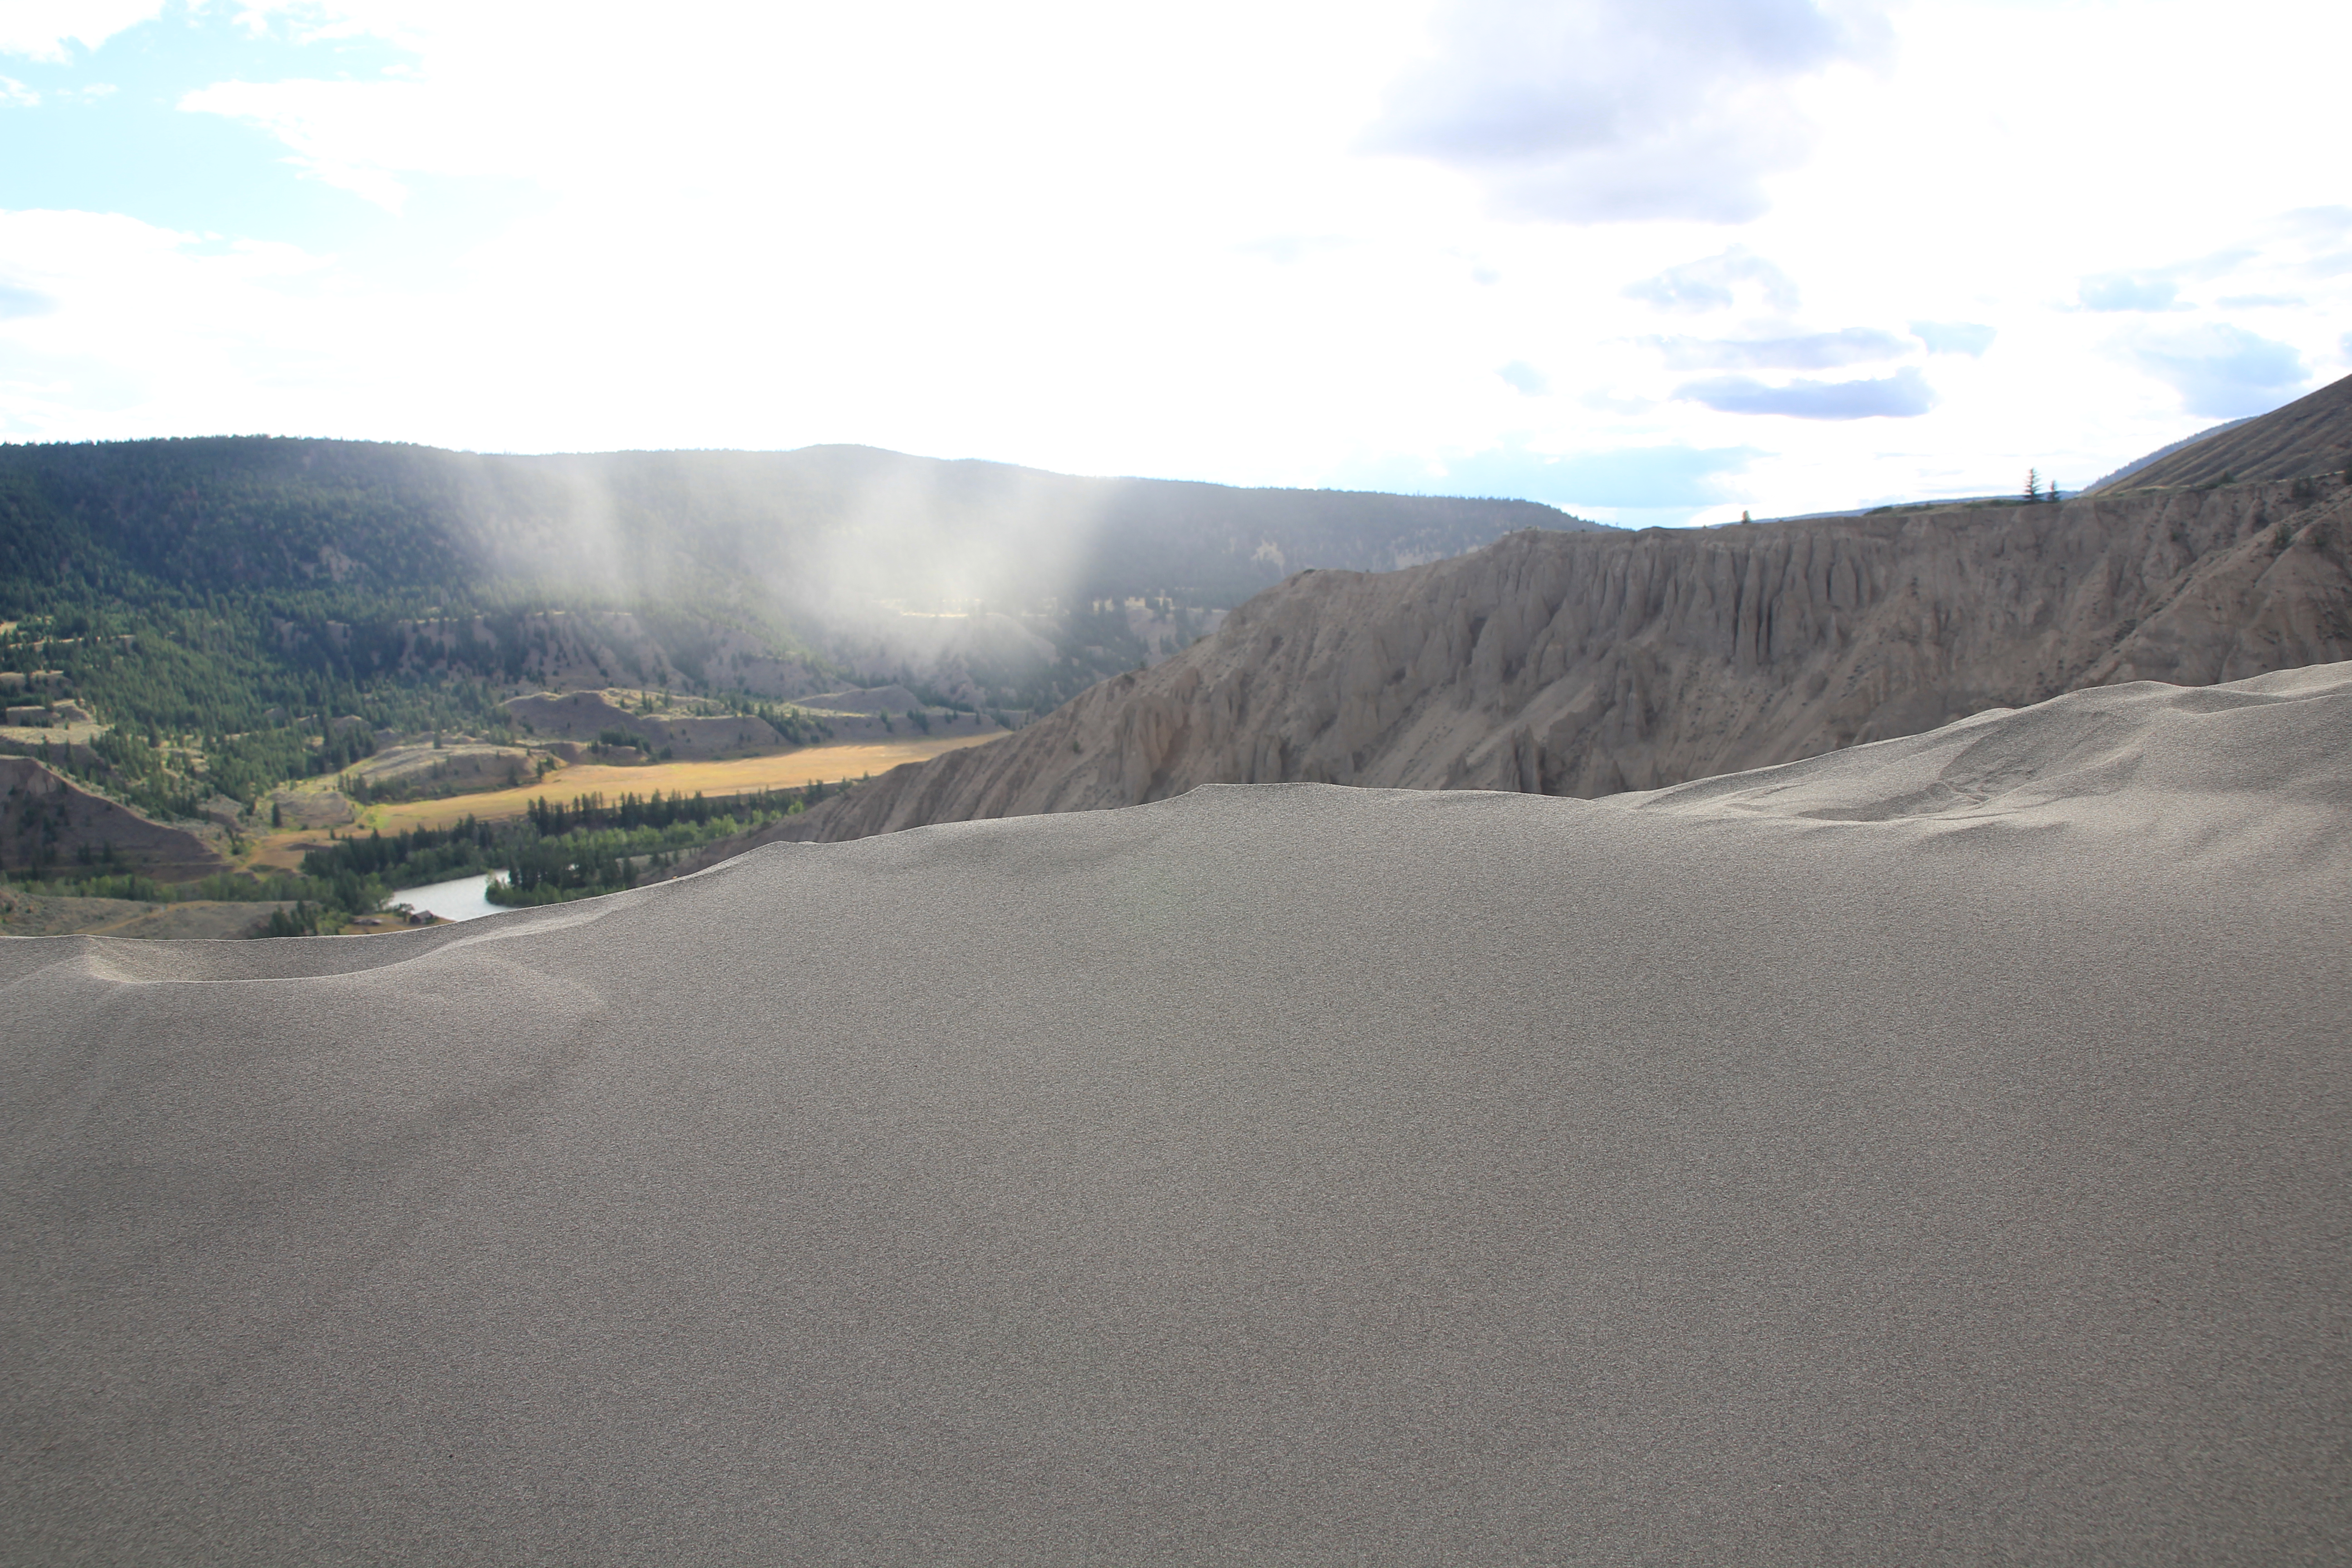
In Canada, the highest extreme temperatures are found in the low elevation southern interior valleys of British Columbia. Ever since my interest in climate data began I have been telling everyone who would listen that Kamloops (in the Thompson Valley) has hotter summers than the Okanagan city of Penticton. It felt good to be shattering people’s hopes and dreams stating that the more southern city of Penticton was not as hot as Kamloops (especially when Kamloops was my place of residence).
But I was shocked to discover this month that I have been wrong for these past 20 years!
It was an honest mistake because the official “average temperature” is actually the median temperature. ie. the average of the daily maximum and daily minimum temperatures.
Comparing Kamloops and Penticton reveals that Kamloops is both hotter during the heat of the day and hotter during the coolest time of day, and therefore, gives a higher median temperature.
With daily data for both cities back to 1907, Kamloops has warmer daily extremes in July about 60% of the time and higher daily lows in the warmest month 94% of the time. Overall, the daily mean temperature is higher in Kamloops 93% of the time (108 of the past 117 years).
So given this data, you can see how climatologists have tricked us (unintentionally) into thinking Kamloops is the hotter city.
There are lies, damned lies, and statistics, so let’s parse out these statistics further to get to the truth of the matter.
First of all, it makes sense to record the average between the high and the low because most weather stations only record the daily highs and lows. However, airport stations have been recording the hourly data since 1953 in Canada so it is possible to calculate the average hourly temperatures, which gives us a truer picture of which location is actually hotter. A perfect scenario would be to take an infinite number of readings per day, but 24 is a good approximation.
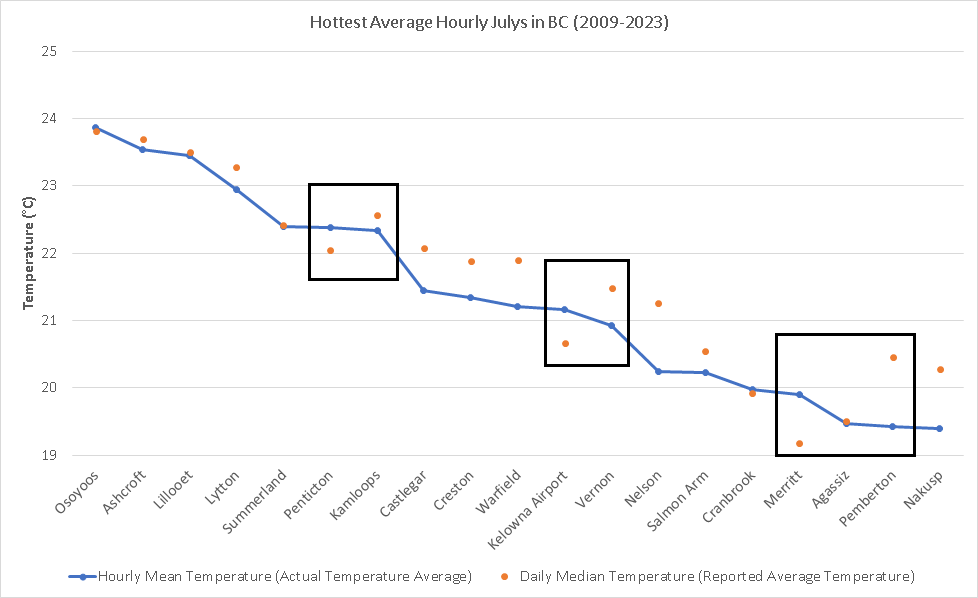
For the southwestern interior valleys, the daily median temperatures exaggerate the actual average hourly temperatures by 0.2°C in the Thompson and Fraser Canyons while the median temperatures under-report the actual hourly data by a similar amount in the Okanagan Valley.
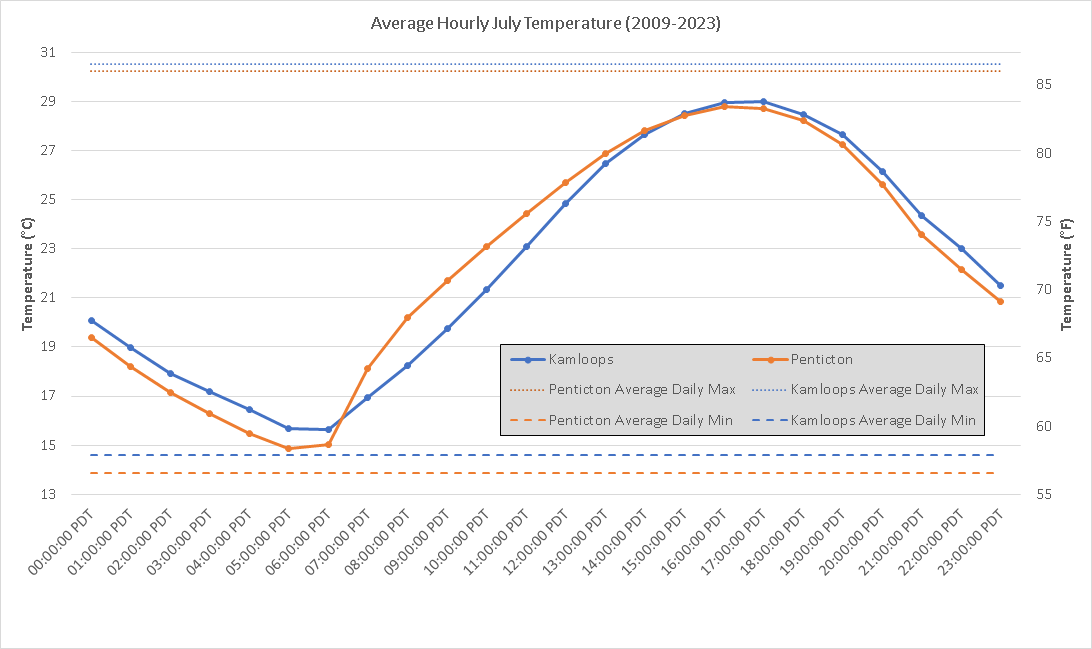
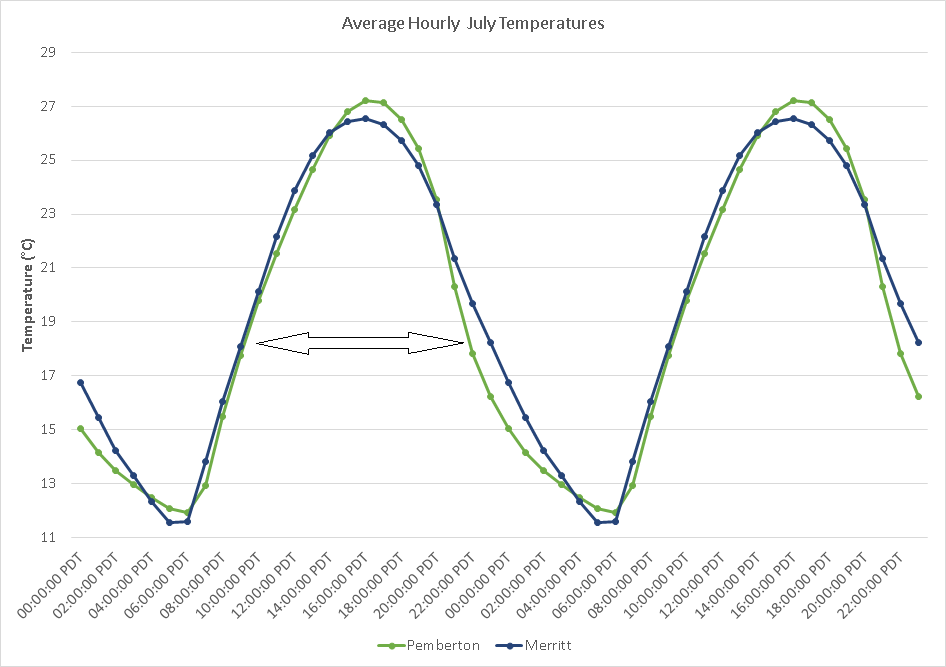
Let’s look at a graph of Kamloops and Penticton as an example.
As you can see, Kamloops is both hotter at the peak heat of the day and warmer at the coolest time of day.
But the average hourly temperature at Penticton is slightly higher because Okanagan cities, of which Penticton is one, warm up much faster. Even though Kamloops is warmer for 16 hours per day vs. 8 for Penticton, Penticton experiences such a massive jump in temperature at 7 am that it’s enough to make the 24 hour average higher than Kamloops.
In summary, if you look at the daily mean temperatures as listed by official sources, Kamloops will appear to be hotter than Penticton, but if you calculate out the hourly temperatures, Penticton is slightly warmer.
Over the past 30 years, Penticton’s average hourly July temperature has been 22.02 degrees Celcius vs. Kamloops where it has averaged 21.99°C. The 0.03°C difference isn’t much, but it’s enough to win bragging rights for hottest city in British Columbia (some towns and villages are hotter still, such as Lillooet, Ashcroft, and Osoyoos, but no city).
The following are mostly long form interviews with Candidates vying to be the US president in 2024. The list will be updated over time. If you would like to add interviews, please leave a comment below.
The response to Jordan Peterson’s “Message to Muslims” has been quite varied. It seems that both atheists and Muslims find it a bit condescending. Peterson’s video can be watched here: https://youtu.be/7pd0HLeYKsE
Here is Apostate Prophet, an atheist with a Muslim background, totally eviscerating Jordan Peterson’s Message as patronizing and naive. https://youtu.be/YpcnfEaPibc
The other videos I’ve watched responding to Peterson were similar, being happy that JP was reaching out, but critical of some of his points, especially the apparent condescension.
Across Canada there are 17 different ways of calculating heat warnings. In addition, Nunavut and northern Quebec do not have any heat warning criteria.
Regional heat warnings are issued in Canada as described in the following map.
The variations across the country are set up in such a way that the number of heat warnings come out somewhat evenly. Since the southern interior of BC and southern Ontario experience the hottest summers in Canada, they have the highest bar to be reached before a heat warning is issued.
This first graph lists 33 different places across Canada, covering all 18 zones (including Nunavut), listed from hottest to coldest. Hotness was calculated by averaging the number heat warning days across all 17 thresholds.
Penticton averages 7.1 days per year across all zones, making it the 6th hottest on the list. But using the criteria for the southern interior of BC, Penticton only averages 0.50 days per year.
By contrast, the northern BC city of Terrace averages 0.93 days per year using all 17 criterion, but with the Environment Canada designated threshold, it actually meets the heat warning designation 5.1 days per year.
Northwestern BC and the Yukon have the lowest threshold requirements in Canada while Penticton, Kamloops and the rest of the BC southern interior have the hardest thresholds to meet.
This is not universally true, however, because these southern interior hotspots like Penticton and Kamloops have an easier time meeting their own requirements than those of southwestern Ontario (around Windsor). Penticton and Kamloops average 0.50 and 1.33 heat warning days per year, but if these cities were using Windsor’s thresholds they’d only get 0.03 and 0.10 days per year, respectively.
Of the 17 heat warning different thresholds, Windsor is the national leader in 16 of them. Only with the BC southern interior criteria does Windsor lose out to Kamloops.
By contrast, using the hot and humid southern Ontario criterion yields the following result:
BC’s dry interior climate means cooler nights and fewer days with a humidex, so using Windsor’s criteria puts Penticton (0.03 days) well below more humid cities like Winnipeg (0.43) and Abbotsford (0.13).
The next graph shows this same data with coastal BC thresholds. This reflects the fact that the Fraser Valley, inland from Vancouver, reaches much higher temperatures in the summer.
And here is the same graph using the Atlantic province thresholds.
At the easy end of the scale is the Yukon and northwestern BC. Also included in the following graph is the large area covering central and northeastern BC, northern and central Alberta, and the Northwest Territories.
Notice that using the Yukon criteria would give Windsor more than 45 heat warning days per year. And that’s just an average summer. Some years could be almost every day all summer!
I suppose Environment Canada wanted to at least have a threshold low enough for the Yukon to achieve heat warnings once in a while, but clearly this same benchmark would not make sense for southern Ontario since so many heat warnings would cause the population to tune them out.
The Yukon criteria gives Whitehorse 0.17 days per year, and it even gives Baker Lake, Nunavut 0.03 days per year (although it’s hard make out in the graph). Port Hardy is the only city in the graph that never gets any heat warnings in any category.
The same cannot be said for the northern Northwest Territories community of Inuvik which averages 0.57 days using the NWT thresholds and 0.63 days with the Yukon thresholds.
Quebec is an interesting one because it’s the only place in Canada that doesn’t look at the daily lows. This greatly boosts the southern BC numbers because of the cooler nights relative to Ontario and Quebec.
The remaining heat warning categories are in the following chart. Notice that northern Ontario and southern Saskatchewan are similar, while the other two are similar.
Circling back to each city’s own designated threshold, recall that Penticton only has one heat wave day every two years on average. The limiting factor is the cold nighttime temperature since daytime temperatures are frequently well above 35°C/95°F threshold.
Now, because other places have lower thresholds, the follow locations have more heat wave days per year than Penticton:
George Orwell once observed that whenever there’s an item in the news where you have intimate knowledge or expertise, the story is almost always factually wrong. When the news story is about something to which you do not have special knowledge, it is factually accurate. The logical conclusion is that almost all news stories contain errors, but we only notice them in our area of expertise.
It is extremely hard to rid ourselves of errors, even when there is no political bias or agenda involved. When reporting on a subject matter where we have little foreknowledge, it’s surprisingly difficult to accurately relay the information to our audience.
If you read this story, you will be left thinking that the province has never used this much electricity, but that would be false because the writer of the above article — like every other report on this topic I have consumed so far — misheard the experts.
I witnessed an example first hand this morning. Listening to CBC Radio from Kelowna, the host was interviewing the representative from FortisBC (the company that supplies power to a large portion of the southern interior), and the interviewer asked if there was record demand for power with Fortis like BC Hydro was reporting.
The Fortis rep said that there was indeed a new summer record for power consumption. The key word here is “summer,” because anyone lucky enough to possess a memory that stretches back more than four years (which isn’t most of us) would know that when BC Hydro hits a new high for electricity demand in the winter, it’s much higher than the “record demand” experienced this week.
As with the other articles written about this “record demand,” this interviewer was playing the game of telephone with the FortisBC representative; she was present when the utterance of the word “summer” came forth, but it did not register with her brain since she was more focused on the word “record.” As a result, she left the impression with listeners that the province hit a new all time record this week for electricity demand in the same fashion that the province achieved a new all time high temperature extreme.
I was also present when the adjective summer was spoken, and would have likely glossed over the word (especially given the interviewer had conditioned the listens to not hear it), but I had just been informed yesterday that the real peak was in the winter. So you could say that I had come into the interview with “special” knowledge, and only because of that did I notice the error.
Notice that the facts were presented during the interview by the expert, but the tone and emphasis by the CBC host meant that most people were mislead.